───✱*.。:。✱*.:。✧*.。✰*.:。✧*.。:。*.。✱ ───
Part A
- Since Part A was mainly just to generate data, I used my resources (ChatGPT) to generate most of the data, and then I went back and changed a few things that were incorrect.
- I don’t see much ‘helpfulness’ of creating the data myself, since it’s a largely menial task which will produce pretty similar results of just asking ChatGPT to generate data. I had to also go back and ensure that the data was ‘realistic’, so I made sure to double check everything.
Part B
Part 1
- For the analysis, it was pretty straightforward. The only thing I needed to ensure was that the species was not null, since there were certain sales items in which it was for products, rather than pets (so I did a
JOINrather than aLEFT JOIN). Interestingly, there are ‘duplicate species’, but that’s just due to different sale locations for each species—since you can purchase species at different locations.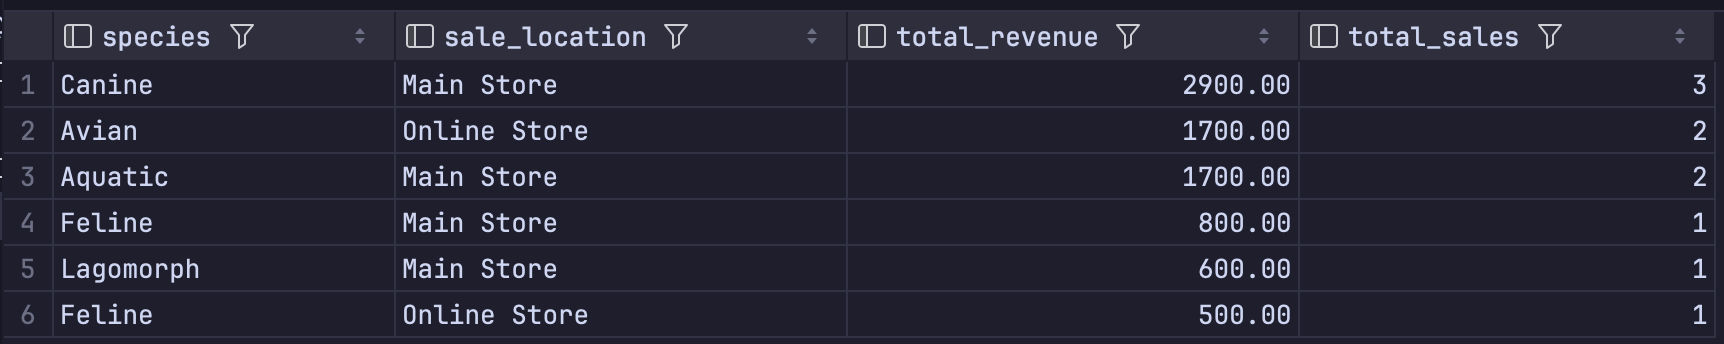
Part 2
- This analysis was pretty straightforward as well; I just utilized the
COUNT,SUM, andAVGfunctions with data fromProductstable. The category habitat has the most total. Also, I added aout_of_stockcolumn, which indicates the number of products that are out of stock within that certain category.
Part 3
- This was pretty simple, I just did the number of total purchases (with the
COUNT). Also, I added the total spent and the average purchase for each planet. Interestingly, Earth is the planet with the highest total spent, although it has the second highest average purchase.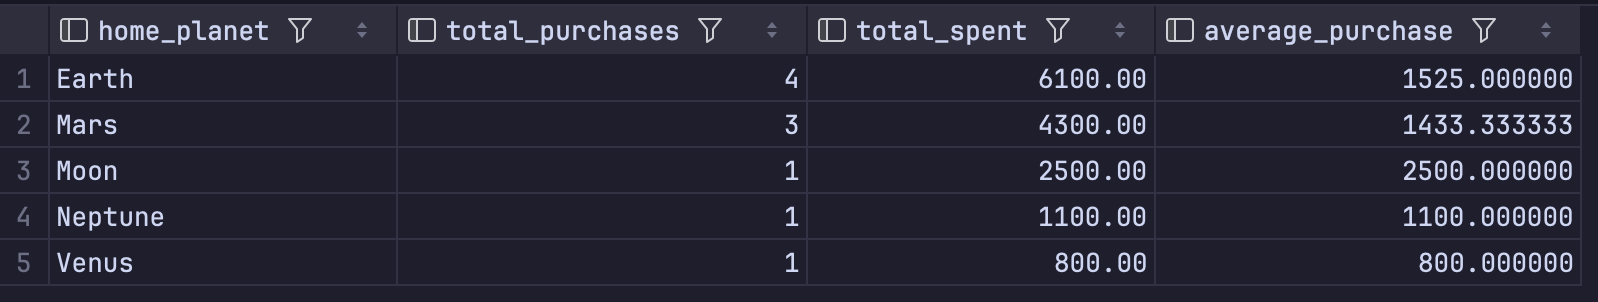
Part C
Part 1
- For this, it was pretty simple to get the actual data. However, to extract the actual ‘month’, formatted nicely, I used the
FORMATfunction, withMMMMas the second argument to display the entire month name.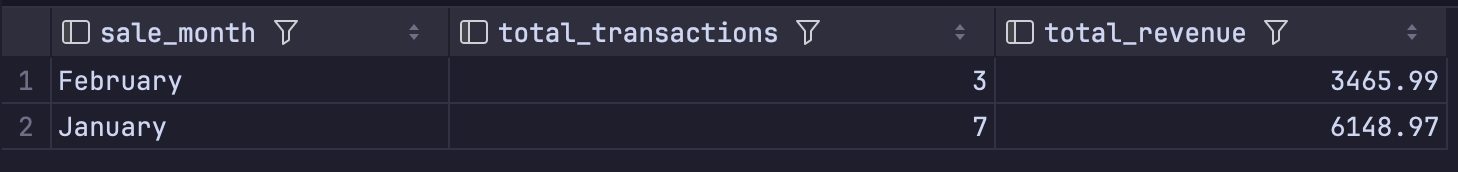
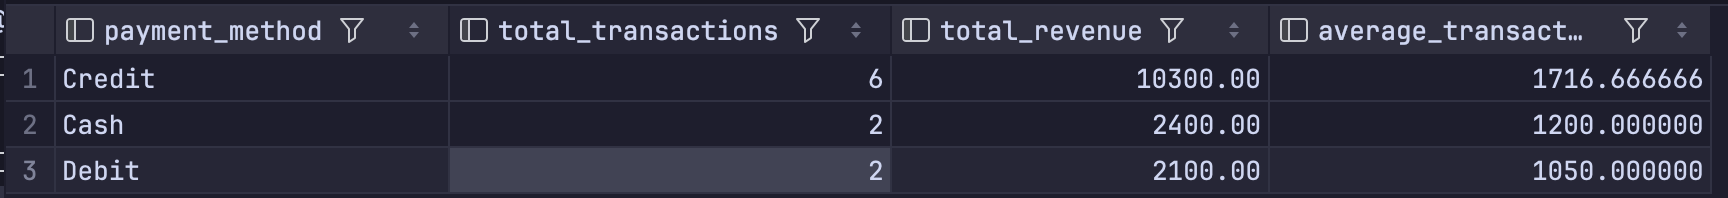
Part 2
- This one was pretty simple as well, I just got the total transactions, the total revenue, and the average transaction for each payment method. The highest average transaction is credit, followed by cash, and then debit.
Part 3
- This is pretty similar to another part within this lab. I did a few functions, such as
SUM,AVG, andCOUNT. The species that has the highest revenue is the Canine species, followed by Aquatic, and then Avian. As for the popularity, I just thought that it would be the total sales volume—since I wasn’t sure how else the popularity would be ranked, unless there was a rating between 0 and 10, but I wasn’t sure how that would be implemented, unless you had a complex fucntion.
───✱*.。:。✱*.:。✧*.。✰*.:。✧*.。:。*.。✱ ───