───✱*.。:。✱*.:。✧*.。✰*.:。✧*.。:。*.。✱ ───
Screenshots
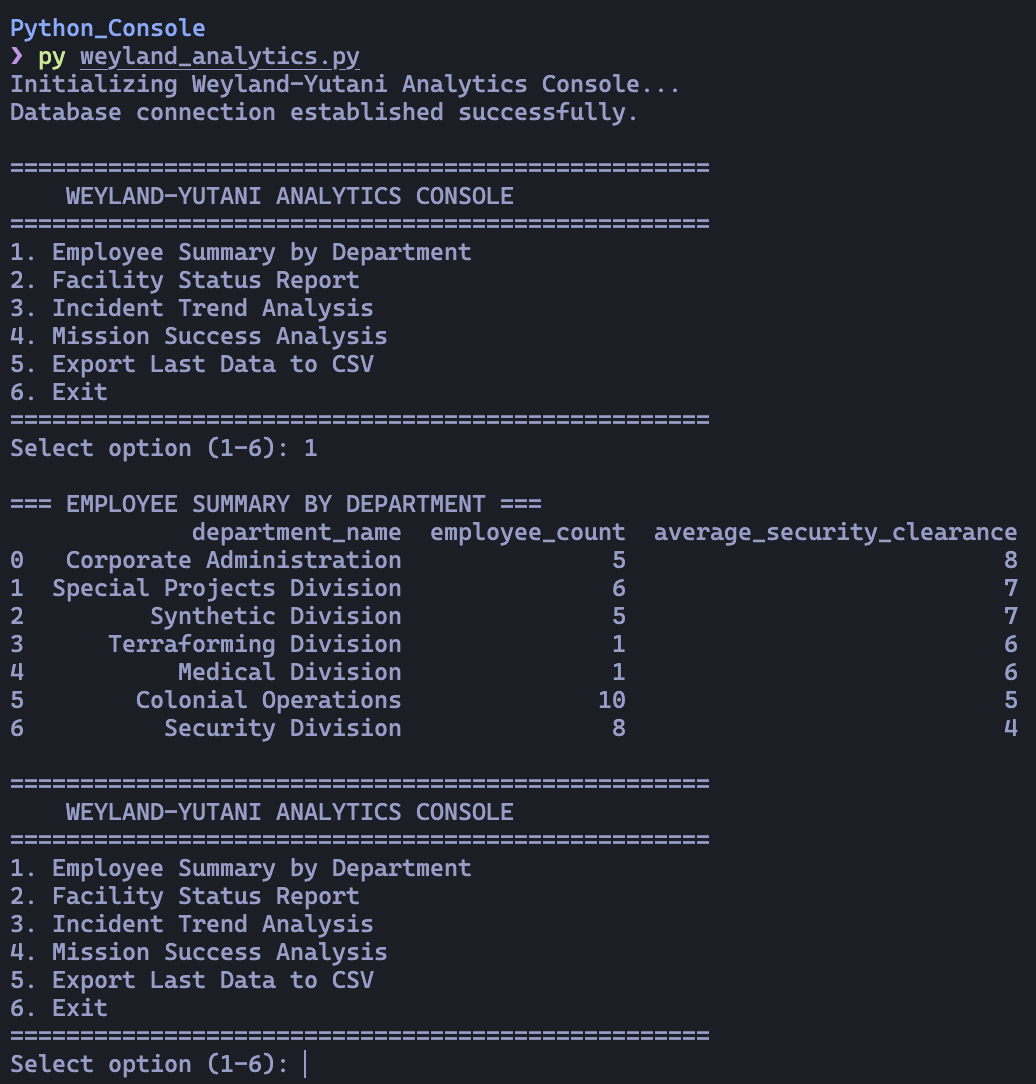
Python Version
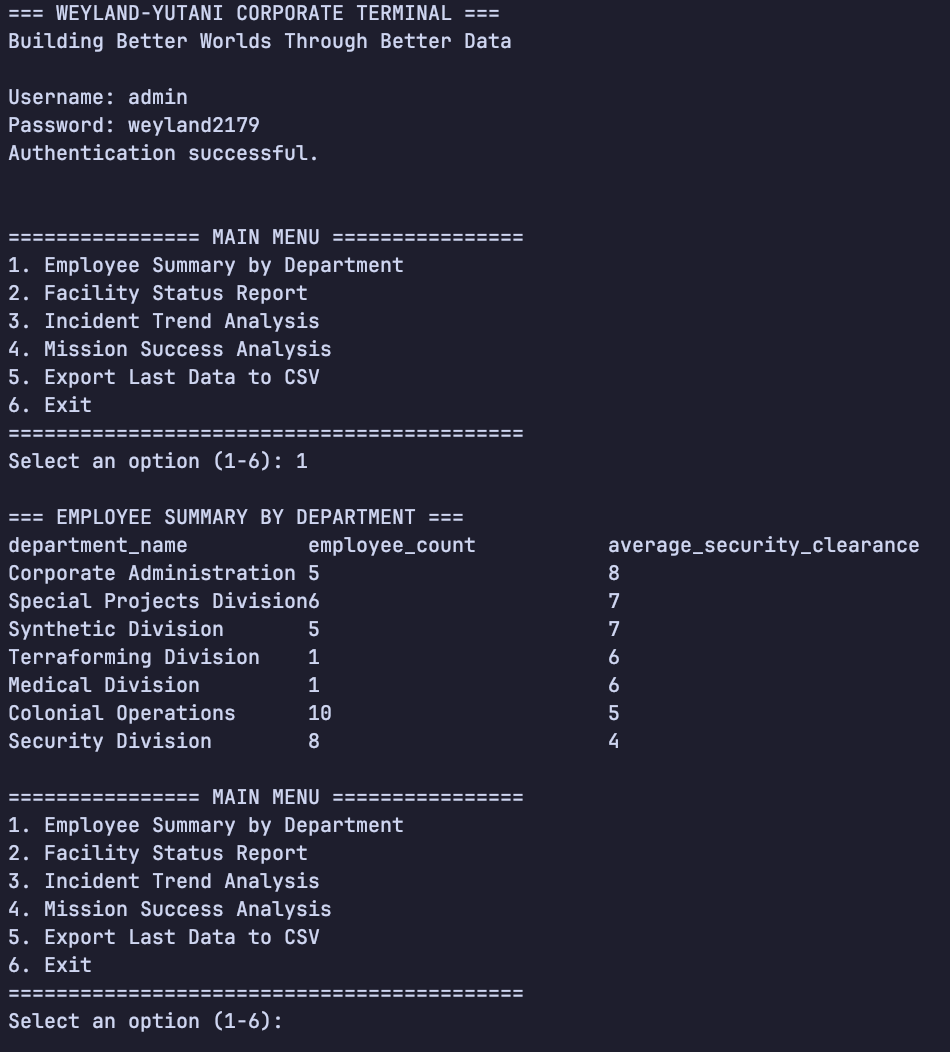
C# Version
Executive Summary
- This project delivers two console applications for Weyland-Yutani’s crisis response analytics—a C# and a Python version. Both connect to the SQL server instance hosting data, which enables field agents to quickly access reports on employees, facilities, incidents, and mission success.
- The design emphasizes portability (two languages—Python for cross-platform and C# for Windows), CSV export for data sharing, and alignment of query outputs across platforms to ensure consistent situation awareness.
Connection Setup
Database Configuration
- Both terminals connect to the
WeylandYutanidatabase on Microsoft SQL Server via port1433(the default port) - C# Uses
Microsoft.Data.SqlClientwith the connection stringServer=127.0.0.1,1433;Database=WeylandYutani;User Id=SA;Password=YourStrong!Password;TrustServerCertificate=true; - Python uses SQLAlchemy (the setup code was originally using pyodbc, but it had a few issues with pandas DataFrames) with the connection string `mssql+pyodbc://SA:YourStrong!Password@127.0.0.1,1433/WeylandYutani?driver=ODBC+Driver+18+for+SQL+Server&TrustServerCertificate=yes
Authentication
- C# application implements interactive login via the
Authenticate()method, which allows 3 attempts and credentials are hardcoded asadmin/weyland2179 - Python application connects directly via the database credentials; no interactive authentication prompt implemented
- In production, both should use env variables or a more secure method of storing credentials, as well as a read-only DB role for the analytics application
Menu Function
Employee Summary
- Aggregates employee count and average security clearance by department using SQL
JOINonEMPLOYEESandDEPARTMENTS - Results sorted by average security clearance (descending) to surface highest-clearance departments first
Facility Status
- Counts facilities by operational status and calculates the average security level per status category
- Helps identify under-secured or offline facilities during emergencies
Incident Trend Analysis
- Groups incidents by year/month using
DATEPARTand categorizes by severity - Reveals monthly patterns in incident frequency and severity for operational forecasting
Mission Success Analysis
- Calculates mission success rate via
completed / total * 100 - Sorts results by success rate and number of assignments to highlight critical mission patterns
Export to CSV
- Both implementations export last viewed dataset to a timestamped CSV file (e.g.,
weyland_data_export_20250812_145233.csv) for offline review or sharing
Integration Challenges and Solutions
- The Python implementation threw deprecation warnings related to pandas DataFrame handling when using
pd.read_sql()with pyodbc—so I ended up switching to SQLAlchemy, which is a layer above pyodbc and worked better - Certain SQL servers column types were read into pandas with unexpected Python types (such as
int64vsfloat64)—this required a little bit of conversion for a clean output - There were slight differences in the SQL server driver behavior between the .NET
SQLClientand Python’spyodbc, which caused a few minor formatting inconsistencies in date/time columns
Crisis Response Impact
- Field teams can quickly pull operation summaries without relying on heavier systems
- Reports highlight high-clearance departments, offline facilities, and mission success trends for targeted intervention
- CSV export allows data to be sent securely or imported into other tools during emergencies
───✱*.。:。✱*.:。✧*.。✰*.:。✧*.。:。*.。✱ ───