───✱*.。:。✱*.:。✧*.。✰*.:。✧*.。:。*.。✱ ───
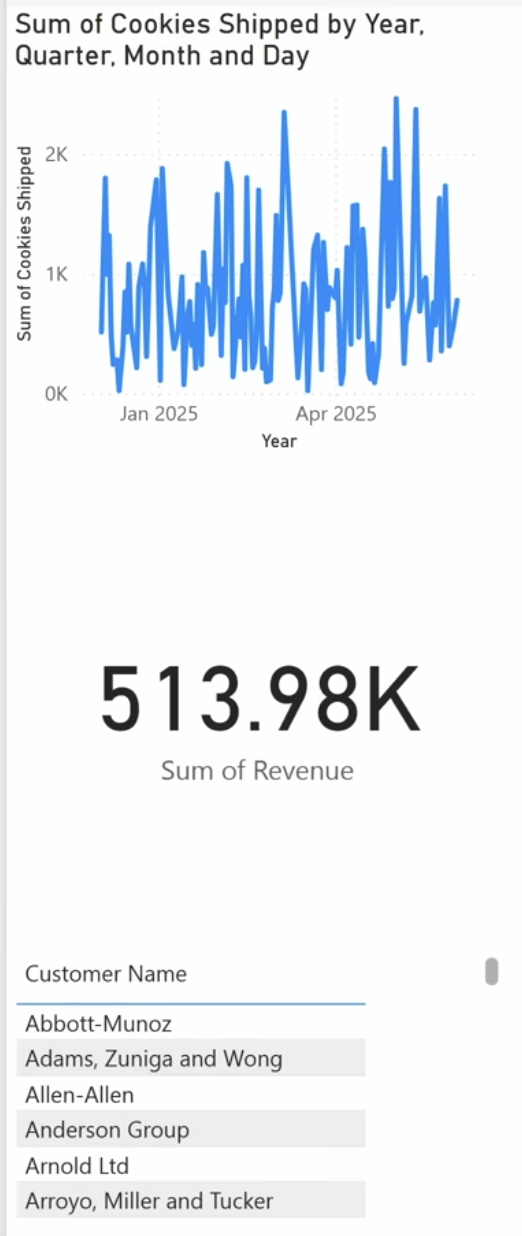
Tutorial Video Screenshot
Visualization Project Plan
For the visualization project, I think I want to use this Global Food Prices (2000 - present) dataset. This dataset includes country_code, date, country, subcountry, market, latitude, longitude, category, and commodity. I think this structure is good since it combines the time, location, and categorical data, so I can make some cool visualizations (hopefully).
I think that this data will be helpful since it would probably spread awareness or at the very least see where areas are disproportionally expensive compared to national or international medians. For instance, places like Los Angeles or New York where the cost of living would have higher food prices; I would assume. Compared to more rural places, you’d have a big discrepancy, and I think that these food prices being like this contributes towards income inequality that plagues the world (probably due to the economic system that the world runs on ).
Planned Visualizations
- KPI Cards
- Number of markets (distinct market_id)
- Number of commodities (distinct commodity)
- Current month median price
- Month-by-month change (median %)
- I think this shows a positive trend that is probably not very good, since food is becoming less affordable (especially for those in other countries presumably)
- Time series line chart
- Monthly median price for selected commodity and country.
- Prices are temporal so a line chart is the cleanest way to see trends, spikes, and seasonality within the data. I think IQR shows dispersion across markets instead of just central tendency
- Small multiples
- A grid of small line charts for the top 6-10 commodities in the US
- I think that this would reveal which items are more volatile vs stable without putting everything on a single plot; it’ll be a little more readable that way
- Geographic map
- Bubbles at market coordinates sized by latest price and colored by deviation from national median; tooltips show market, commodity, and current price
- I think that since prices are spatial, mapping the geographic hotspots and potential transport or supply constraints would be good. I think the bubble color relative to the national median would also help quickly identify outliers.
- Category comparison bar chart
- Median price (or normalized index) by category (e.g., cereals, pulses, oils) with error bars showing variability.
- Category-level aggregation helps frame which commodity groups contribute most to household cost pressures. Error bars highlight uncertainty and dispersion.
- Market dispersion box plots
- For a selected month and commodity: box plot of market-level prices across the country.
- Summarizes distribution succinctly, making it easy to compare dispersion month to month and identify outliers.
- Price index baseline chart
- Normalize each commodity to 100 at a chosen baseline date; plot indexed price over time to compare relative changes across items.
- Different commodities have different absolute price levels. Indexing lets us compare percentage change trajectories fairly.
- Volatility ranking table
- Table of commodities with metrics: coefficient of variation, median price, number of markets reporting, last update date.
- A ranked list helps prioritize monitoring and intervention where volatility and coverage justify attention.
───✱*.。:。✱*.:。✧*.。✰*.:。✧*.。:。*.。✱ ───